
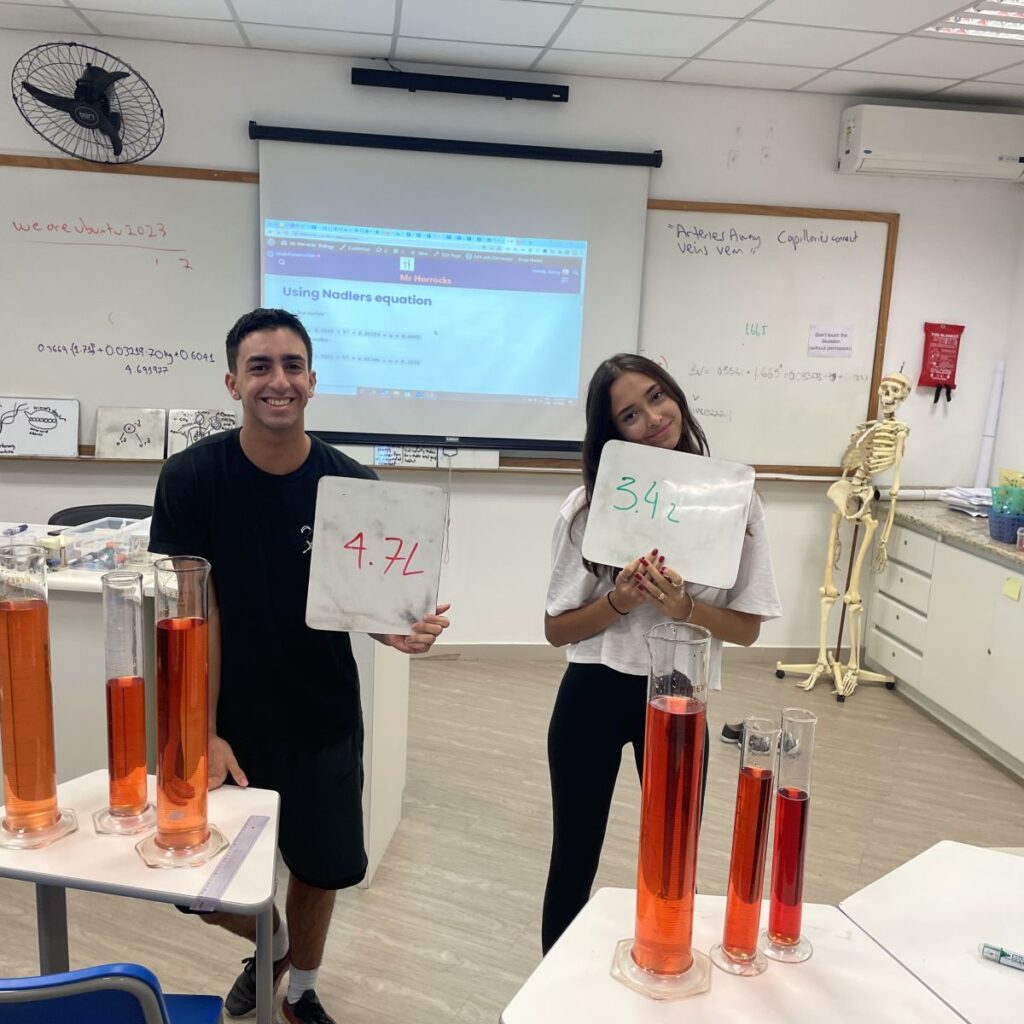
My students used the Nadler equation to estimate probably the amount of blood contained in their bodies.
Most of us have difficulty visualising a quantity based on numerical data, so we decided to make things a little more visual.
Following the de-bunking of the `VAK’ learning styles, that is the idea that we are all one of three categories by the way that we learn, that is visual, auditory of kinesthetic learners.
The data is pretty clear that noone likes to learn by simply listening. Bringing movement into classes is essential, not just for learning but also for health.
We know appreciate that ALL OF US benefit from making learning a bit more visual, as the powerful work done by the Harvard education lab ‘Project Zero’ has made abundantly clear.
Needless to say, we used a little red food coloring to add a little dramatic effect to our visualision process.
It impressed me how motivated young people can be do do math equations, when the outcome has personal significance. I gave my class the option of sitting out on calculating their personal blood volumes. Every student insisted on completing the calculation, and many asked to re-measure their height and weight again until the accuracy of the estimate was to their satisfaction.
The lesson left me much to ponder, on how us biology teachers can do more simple exercises like this that support more personalised engagement with theory.
Facebook
Twitter
LinkedIn